In August, we shared our view that inflationary risks are transitory and our positive macro outlook is partially offset by the risk of a prolonged pandemic. Since then, most recent data shows inflation has hit a 31-year high, and last week the Fed Chair ditched the word ‘transitory’ from its characterization of inflation developments as the Fed moves to accelerate the taper timeline in response to higher prices.
Key takeaway: It is evident that the primary drivers of inflationary pressures are ebbing/stabilizing. Market volatility remains high in the face of Omicron-variant driven selloff and Fed policy actions. What happens next is anyone's guess. We believe our investments remain strongly positioned in the long term. Copying a quip from our Feb 2020 investor memo: This too shall pass!
As noted before, inflation taxes nominal returns, hence it's important to properly position our portfolio if we truly are in a prolonged inflationary environment. The keyword here is if - and today we revisit the drivers of inflation as reflected in the Consumer Price Index (CPI) measure.
CPI aggregates changes in prices for different expenditure categories (e.g. rent, energy, food, etc) based on varying degrees of weights (or relative importance). Rent & equivalent accounts for roughly 33% of the weight, food (14%), autos (3%) energy (7%), and so on. Food and energy prices are usually volatile and therefore removed in another measure called the Core CPI. Per the latest data, YoY CPI was at 6.2% and core CPI at 4.6%, both a multi-decade high. At any time, it is possible to isolate key drivers of price changes as measured by CPI and in essence answer: If prices jumped 6.2% YoY in October, how much of that was driven by energy prices?
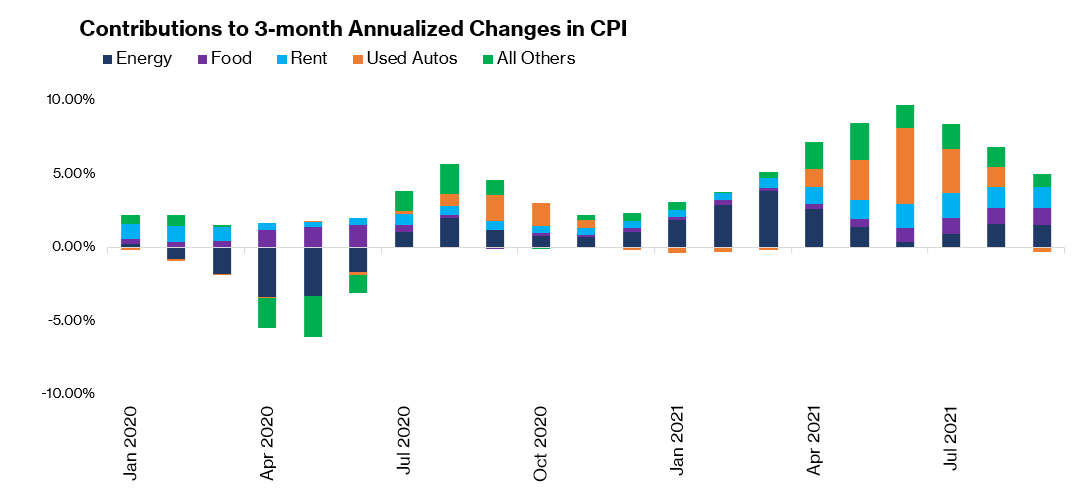
Typically, CPI measures are reported on a YoY basis which can bias the result as much of the world was in lockdown and global supply chains were even more disrupted this time last year. We tackle this by taking 3-month annualized changes in CPI.
The inflationary pressures heated up over the summer, peaking in June before starting to decelerate. The price surge was mostly driven by supply disruption for used cars due to chip shortages. Zooming out to 2013, the data reaffirms the historic nature of recent price pressures.
But as we start to review the drivers, it's evident that this surge is pandemic-driven and less probable to sustain over time. This great piece by the team at Bridgewater elucidates the demand- vs supply factors of the shock.
Autos drove the surge over the Summer to new levels but this pressure is subsiding.
The imbalance in the housing market means that rent continues to drive recent inflation surges (adding +1.4% through Oct compared to the historic average of 1%). Nonetheless, the bump isn't exactly out of the ordinary!
Contributions of highly volatile outliers like food & energy remain accentuated to well, more of the same.
Our “All others” residual that captures everything else, accelerated in the first half of the year but is stabilizing as decomposed on a 3 month-annualized basis.
Evidently, the compounding effect from the multi-factor drivers of consumer price inflation — as reflected by the 3-month annualized CPI which peaked in June, is starting to ebb/stabilize. What happens next (with Omicron) is anyone's guess. One lingering question is whether these price pressures will feed into wage developments and inflation expectations. Also, market volatility remains high in the face of the Omicron-driven sell-off and Fed policy actions (including communication). For us, we are not partaking in the selloffs and believe our investments remain strongly positioned in the long term. To copy a line from our Feb 2020 investor letter (at the height of sharp market selloff): This too shall pass! When the dust settles, life will move on. Till then brace yourself and pounce on this opportunity!
The Xantos Labs Team


